MISSION 015               goo.gl/JKN1Zq             DIFFICULTY: █████░░░░░ [5╱10]
┅┅┅┅┅┅┅┅┅┅┅┅┅┅┅┅┅┅┅┅┅┅┅┅┅┅┅┅┅┅┅┅┅┅┅┅┅┅┅┅┅┅┅┅┅┅┅┅┅┅┅┅┅┅┅┅┅┅┅┅┅┅┅┅┅┅┅┅┅┅┅┅┅┅┅┅┅┅┅┅┅┅┅┅┅┅┅
One of our operatives managed to find an information leak vulnerability on an
internal website of a hostile syndicate. The vulnerability itself is quite
amusing, as it allows to leak any file on the FS in form of a bar chart. Our
operative leaked a script responsible for authenticating a system operator.

Your task is to analyze the chart and then the script, and attempt to recover
system operator's password.

  Chart: goo.gl/YbYYcS

Good luck!
Task sounds pretty interesting. Represent files as a chart? Cool!
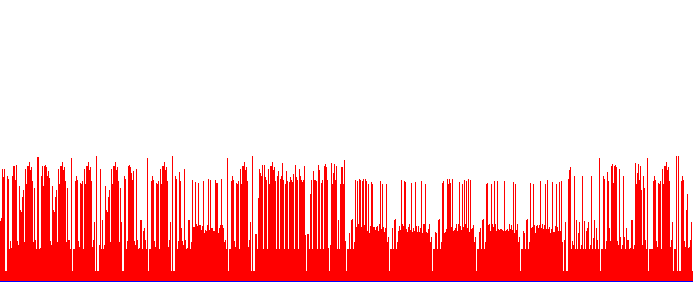
Let’s take a look at the chart we’re given!
 lots of spikes, huh
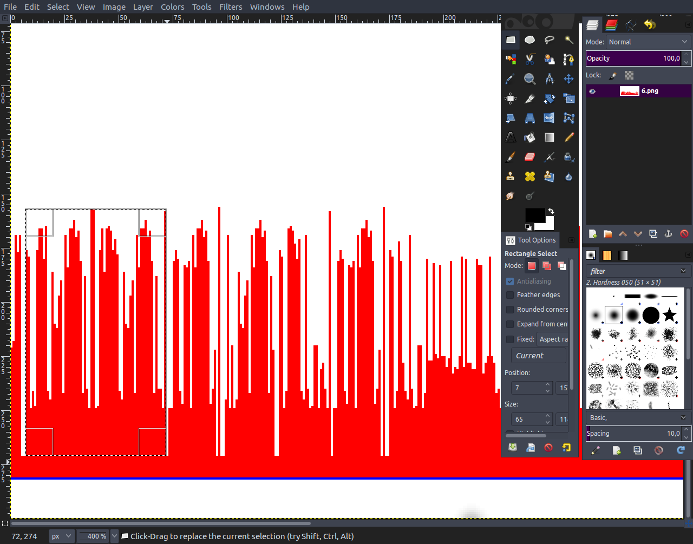
Okay, so we see various spikes, some regularities… and… I am stuck. I’ve got no idea how to proceed here, I cannot give up just yet though. When I think of FS, for some reason, I immediately associate them with dotfiles and the regularities in certain chunks of the chart remind me of dot in front of files. So… how can one represent a .file name in a chart? The amount of spikes representing ascii values maybe? Let’s see if it’s plausible.
 nope
nope
The largest chunk seems to be 65px wide, which would result in ascii ‘A’, and somewhat regular gaps aren’t wide enough for them to represent anything meaningful, so it’s unlikely that amount of spikes would be the thing we’re looking for. What about their length? It’d be good if we had something to count the length of spikes for us, since there’s 693 of them. Let’s write a script to aid us. We’ll start by checking (r, g, b) values of colours present in the chart!
from PIL import Image
from itertools import product

chart = Image.open("chart.png")
colours = []
for val in product(range(693), range(300)):
    if chart.getpixel(val) not in colours:
        colours.append(chart.getpixel(val))
print colours
which results in [(255, 255, 255), (255, 0, 0), (0, 0, 255)] so white, red and blue respectively. We’re lucky! It’s only 3 colours so we won’t have to worry about shades and such. Now that we know what we’re looking for and what we’re dealing with, let’s modify our previous script a little.
from __future__ import print_function
from PIL import Image
from itertools import product

chart = Image.open("chart.png")
spikelen = 0
for val in product(range(693), range(300)):
    if chart.getpixel(val) == (255, 0, 0):   #(255, 0 ,0) == red
        spikelen += 1
    else:
        if spikelen != 0:
            print(chr(spikelen), end = '')
        spikelen = 0
which gives us a neat output of: (yes, I know my python is horrible ;)
<?php

if (!isset($_GET['password']) || !is_string($_GET['password'])) {
  die("bad password");
}

$p = $_GET['password'];

if (strlen($p) !== 25) {
  die("bad password");
}

if (md5($p) !== 'e66c97b8837d0328f3e5522ebb058f85') {
  die("bad password");
}

// Split the password in five and check the pieces.
// We need to be sure!
$values = array(
  0 => 'e6d9fe6df8fd2a07ca6636729d4a615a',
  5 => '273e97dc41693b152c71715d099a1049',
  10 => 'bd014fafb6f235929c73a6e9d5f1e458',
  15 => 'ab892a96d92d434432d23429483c0a39',
  20 => 'b56a807858d5948a4e4604c117a62c2d'
);

for ($i = 0; $i < 25; $i += 5) {
  if (md5(substr($p, $i, 5)) !== $values[$i]) {
    die("bad password");
  }
}

die("GW!");
It worked! While it isn’t the script file name I was looking for, it sure does look like script itself! So… what do we have here? We know the password we’re looking for is 25 characters long and it seems it got split into chunks of 5, which then got treated with md5. So… while trying to check md5 hash of 5 characters wouldn’t be too bad, we may as well try our luck with online databases and tools like this.
e6d9fe6df8fd2a07ca6636729d4a615a MD5 : Pie[space]c
273e97dc41693b152c71715d099a1049 MD5 : harts
bd014fafb6f235929c73a6e9d5f1e458 MD5 : [space]are[space]
ab892a96d92d434432d23429483c0a39 MD5 : delic
b56a807858d5948a4e4604c117a62c2d MD5 : ious!
Ha, we’re home. Not only it found the hashes but also did it fairly fast, in less than 0.7s! What if we wanted to attempt finding them ourselves? Let’s see.
import hashlib
from itertools import product
import string

alphabet = string.ascii_lowercase + string.ascii_uppercase + ' ' + '!'

targethash = ['e6d9fe6df8fd2a07ca6636729d4a615a',
              '273e97dc41693b152c71715d099a1049',
              'bd014fafb6f235929c73a6e9d5f1e458',
              'ab892a96d92d434432d23429483c0a39',
              'b56a807858d5948a4e4604c117a62c2d']

for key in product(alphabet, repeat = 5):
    hash = hashlib.md5("".join(key)).hexdigest()
    if hash in targethash:
        print hash + "=>" + "".join(key)
which after few minutes spews this little list out:
ab892a96d92d434432d23429483c0a39=>delic
273e97dc41693b152c71715d099a1049=>harts
b56a807858d5948a4e4604c117a62c2d=>ious!
e6d9fe6df8fd2a07ca6636729d4a615a=>Pie c
bd014fafb6f235929c73a6e9d5f1e458=> are
…and that’s it!